The Solar-Stellar Spectrograph
[ Home | About | Tech Info & Data | Publications | References ] [ Site by Jeffrey Hall | Research funded by NSF ]
Spectrum extraction
We require several steps to get to the point of removing the scattered light background from the data frames, and finally we are ready to extract the spectra. This uses the same computer routines we used to extract the flat field spectra. Using the map of the spectral orders as a guide, we step along each pixel of each order and extract all the light in the pixels. Since in the previous steps we removed everything related to the instrument and spurious light, all that is left at this point is sunlight and starlight. Thus, the spectrum extraction yields the "unpolluted" spectrum of the Sun or star.
Extracting object spectra
The scattered light removal routine sets the order bases to zero everywhere along the dispersion direction, so we can now extract the raw (e.g., non-normalized) spectra. Our software system's Spectrum object does double duty in this regard, since we use it first to generate the flat field spectra that are subsequently used to flatten the solar and stellar frames, and then in this step to extract the solar and stellar spectra themselves.
For this step, we make one small change to the extraction procedure. We extract the well-exposed flats using a straight sum of the ADU counts in the pixels within the order aperture, incorporating fractional pixels at the aperture edges. If i is the current pixel along the dispersion direction and j denotes the set of pixels across the order aperture at i, we have for the flat fields
where D are the ADU values and α is the fraction of the 0th pixel that lies in the aperture. For the solar and stellar spectra, however, it is advantageous to maximize the signal to noise ratio (SNR), so we use a profile-weighted extraction:
where Pij is the normalized fractional contribution of each pixel in the aperture to the total profile, including the necessary correction for fractional pixels at the order edges. In this scheme, the pixels near the center of the profile (and which ipso facto have the highest SNR) are weighted highest in the extracted spectra.
A sample spectrum
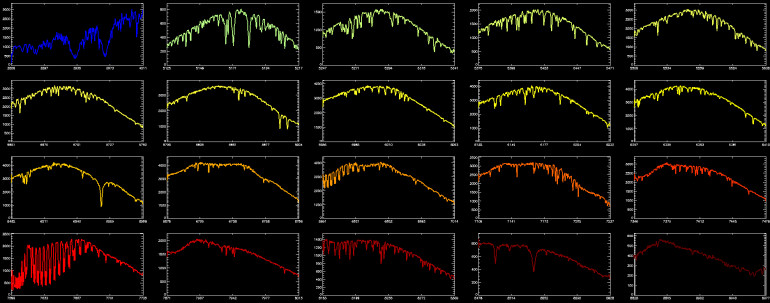
In Figure 1, we show a sample spectrum (of HD 39587, in case you're wondering) produced by the spectrum extraction object. The orders are not normalized, but the pronounced gain variations evident in Figure 1 in the flat fielding description have been removed.

Fig. 1. A representative extracted spectrum. The echelle blaze is clearly still apparent, but the continuum is recovered nicely in orders with substantial gain variations (the redmost orders).
The Ca H & K order is at upper left, and the Hα order is two panels below it.
It remains now only to (1) normalize the extracted continua to unity and (2) apply a wavelength calibration.
Continue to a description of continuum normalization.

[Back to contents]
[ Back to my home page | Email me: jch [at] lowell [dot] edu ]
The SSS is publicly funded. Unless explicitly noted otherwise, everything on this site is in the public domain.
If you use or quote our results or images, we appreciate an acknowledgment.
This site is best viewed with Mozilla Firefox.