The Solar-Stellar Spectrograph
[ Home | About | Tech Info & Data | Publications | References ] [ Site by Jeffrey Hall | Research funded by NSF ]
Flat field corrections
Not all CCD pixels are created equal. Some may be more sensitive to light than others, and some may accumulate charge faster than others even in the absence of light falling on them. To compensate for this, we take flat field frames, which are exposures of a white light source. Think of it as a "blank" star against which we calibrate our real solar and stellar data. We start by tracing the ordermap for a flat field frame, after which we have to do two things: (1) extract its spectrum and (2) divide our other frames by this spectrum to remove any variations that may be present.
Extracting the flat field spectrum
The first part of flat fielding SSS data involves extracting the spectrum of the quartz lamp. This is a straightforward procedure: for each pixel j along the dispersion axis of each order i, we compute the straight sum of the ADUs across the 9-pixel aperture.
Here, D is the ADU value in the ijth pixel, and α is the fraction of the 0th pixel that lies in the aperture; by definition, (1-α) of the last pixel must lie within the aperture. We show typical flat field extracted orders for the old and new cameras in Figures 1 and 2 below.

Fig. 1. Representative extracted orders of the quartz lamp, 1992-2007 data. The left panel shows diffraction order 26 from the echelle (the Ca II IRT order); red is the normalized spectrum and orange is the normalized blaze. The right panel shows the Ca II H&K order; blue is the normalized spectrum and purple is the blaze. Both CCDs were cosmetically poor and show substantial variations in most orders. However, our flat fielding routines demonstrably remove these variations quite well; see text below.

Fig. 2. Representative extracted orders of the quartz lamp, 2008+ data. The left panel shows diffraction order 30 from the echelle; red is the normalized spectrum and orange is the normalized blaze. The right panel shows the Ca II H&K order; blue is the normalized spectrum and purple is the blaze. The new red CCD is reasonably well behaved in the mid-optical (5000-6400 Å), but has large variations in the far red. The new blue CCD, however, is extremely well-behaved. Looking at the blue spectra from Figure 1 and this figure, the Crocodile Hunter might have said, "That's not a flat field....tha-a-a-t's a flat field!"
Determining and saving the blaze function
The spectra in Figures 1 and 2 above are normalized to unity. We perform the normalization by fitting a cubic spline to several points along each order and then dividing the spectrum by the fit. This produces the spectra with a baseline of unity shown in red and blue lines in the figures above. The motivation is to preserve ADU values in the object spectra when dividing them by the flats.
The cubic spline fit for each order is an empirically determined blaze for that order. It increases the accuracy of normalizing the solar and stellar frames to remove the blaze prior to normalization, so we also save the normalized blazes for every flat field frame. The blaze for the orders in Figures 1 and 2 is shown by the orange and purple lines.
Taking stock
As a result of ordermap tracing and flat field spectrum extraction, therefore, we have accumulated four reference files for every flat field frame in our database. For a representative flat field frame NNNNN, we have:
NNNNN.ordmap, containing the order profile centroids for every pixel of every order (512 x [20, 16]);
NNNNN.ordproffits, containing all the Gaussian fits used to determine the locations in .ordmap (9 x 6 x [20, 16])
NNNNN.spec, containing the flat field spectra (512 x [20, 16]);
NNNNN.flatfit, containing the normalized blaze for every order (512 x [20, 16]);
where the files will have 20 or 16 rows (i.e., orders) for pre- and post-2008 data, respectively. Get it? Got it. Good!
Dividing object frames by the flat field spectrum
After we create normalized flat field spectra, we divide every object frame by a flat field spectrum to remove the pixel-to-pixel gain variations. We must address two things here: the procedure and one assumption we make about the data.
Procedure
The steps our software takes are as follows.
1. Load a debiased object frame (a full, 512 x 400 data array).
2. Load the flat field spectrum taken the same day or evening (a 512 x [20,16] array).
3. For every order i and every pixel j along that order, divide all the pixels lying within the order aperture by the (i,j)th flat field spectrum value. Since the flat field spectra are normalized to unity, the data values of the object frame are not significantly altered, and gain variations along the order are removed.

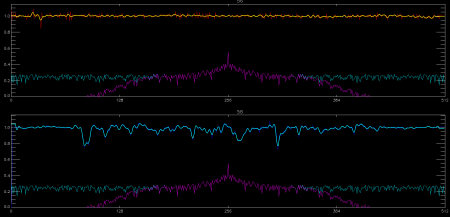
Fig. 3. Extracted orders in the red (top) and blue (bottom) of the new echelle camera (light blue line, at top). Significant gain variations are apparent in the blue due to cosmetic defects on the CCD. The Fourier transforms of the spectra are shown in blue at bottom. We filter out high-frequency noise in the raw spectrum (pink lines) to obtain a low-noise flat field spectrum.
4. To minimize the noise in the flat field spectra, we pass each extracted order through a high-pass filter (i.e., we remove the highest frequencies from the order's Fourier transform and then take the inverse transform). We find this to be necessary in all our spectra, especially for the old cameras, due to the presence of high-frequency, uniformly distributed noise that degrades the SNR uniformly for all orders in all spectra. In Figure 3, we show the effects of the FFT filtering on the flat field spectra. The yellow and light blue spectra show the normalized, noise-reduced flat field spectra. The high-pass filter removes noise without altering the overall trace of the gain variations. The light blue line at bottom is the Fourier transform, showing the presence of uniform power out to very high frequencies. In pink is the result of the high-pass filter, which removes the noise while preserving all legitimate information contained in the spectrum. We employ the same procedure in extraction of our target spectra.
The four-step method above makes one important assumption. Since we divide each individual pixel across the order profile of the spectra by the total, albeit normalized, value of the flat field spectrum, we tacitly assume the profile does not deviate from a Gaussian; i.e., that the relative contribution of each pixel across the order profile does not change as we move along the order. This is true for almost the entire set of spectral orders in both the old and new cameras. It is not true for selected pixels in the blue spectrum of the old cameras; that CCD was riddled with cosmetic defects and in a few places, the order profiles are compromised. The affected areas do not lie in the H and K lines and do not affect the normalization of the order, so our Ca time series are unaffected.
Characteristics of the flat field frames
Results
The two figures below show the complete set of normalized flat field spectra for the red and blue cameras for our solar data. Results for the stellar data are analogous.

Fig 4. The normalized flats (left) and blaze functions (right) for order 38 of nearly 1100 solar frames from 1994 through 2008. The spectra are roughly color-coded by date from the 1994 data (blue) to 2007 data (pink); data for the new (2008) cameras are shown in red.

Fig 5. The normalized flats for the blue cameras, plotted in the same was as Figure 4. The plot of the blue spectra looks ghastly due to the numerous CCD defects and small shifts of the order from night to night. See the bottom panel of Figure 3 for a representative single spectrum.

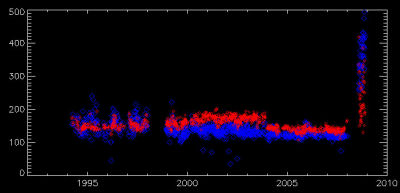
Fig 6. Signal-to-noise ratio (SNR) in the flat field spectra. Red diamonds show the SNR in order 38 of the echelle; blue diamonds show the SNR for the HK order. The greatly improved read noise of the new cameras (2008+ data) is evident.
We also track the SNR in the flat field spectra in parts of the red and blue orders without large gain variations. The results appear in Figure 6. It remains consistent at about 130 for the old cameras and is markedly improved in the new cameras, especially in the blue chip, which appears to be cosmetically excellent.
Discussion
Of some concern is the poor cosmetic quality of the old blue CCD (see Figure 3, bottom panel and Figure 5, left panel). Of course, delaing with such defects is exactly what flat field frames are for, and for orders with well-defined continua, we clearly recover the uniform, well-defined continuum even in orders with very large variations in the flat field spectra (such as red order 26, shown in Figure 1, left panel). However, in the heavily blanketed blue order, we wish to ensure the flat field division is doing its job correctly, partly in the weak and critical cores of the HK lines.
We accomplish this by ongoing comparison of our solar HK spectra to the high resolution spectrum of the same bandpass from the Kurucz solar atlas, degraded to the resolution of the SSS. Failure of the flat fielding algorithm at any point along the order will be apparent in systematic deviations of our spectrum from the Kurucz spectrum. We do occasionally observe such deviations, but in only a few spectra which we then discard.
Continue to a description of scattered light removal.

[Back to contents]
[ Back to my home page | Email me: jch [at] lowell [dot] edu ]
The SSS is publicly funded. Unless explicitly noted otherwise, everything on this site is in the public domain.
If you use or quote our results or images, we appreciate an acknowledgment.
This site is best viewed with Mozilla Firefox.