The Solar-Stellar Spectrograph
[ Home | About | Tech Info & Data | Publications | References ] [ Site by Jeffrey Hall | Research funded by NSF ]
Debiasing the data
As promised in our introduction to the data reduction articles, here is the first of our layperson-level explanations of what's going on in this step.
The amount of sunlight or starlight collected in each pixel of the detector during each observation is converted to a number we express in terms of "ADU" (Analog to Digital Units). However, this value includes an electronic background, inherent to the CCD (Charge-Coupled Device) detector, that has nothing to do with the observation. I.e., we might measure 5000 ADU in a given pixel, but we might also find that on average, there is a background of some amount B in every pixel of the CCD. Thus, the greatest amount of light that can come from the star in our sample pixel is 5000 - B. If we ignore B, our estimates of solar and stellar variations will be artificially low. So in this step, we figure out what B is for each of our cameras, and subtract it from the data.
Debiasing

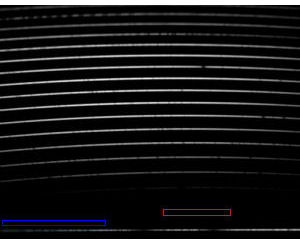
Fig. 1. A raw SSS data frame with bias reference rectangles indicated.
We remove the electronic bias from each CCD separately. In Figure 1, the blue (Ca HK) spectrum occupies the bottom 32 rows, while the echelle occupies the upper 368. We set the Bias object to use the indicated rectangles as the spectrum-free regions for determining the bias level, and obtain the mean ADU value in each rectangle. We subtract each mean from every pixel of the corresponding part of the frame:
,
where D are the data values and B is the bias level determined for each CCD. Obviously, the first equation above applies only to the bottom 32 rows of the image in Figure 1, while the second is applied to the rest.
All frames (flats, ThArs, solars, stellars) are debiased and the full frame stored as [frame].db. We also store the mean and standard deviation of the bias level on each CCD, with solar and stellar data stored in separate files. Although the overall shape of the 2D bias on both CCDs remains nearly constant over time, the baseline bias level varies considerably, especially for the old cameras. Details of these variations are displayed and discussed below.
Debiased frames

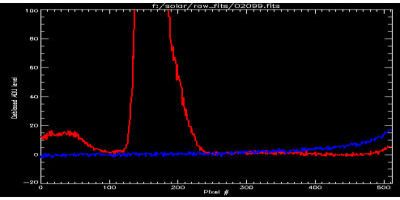
Fig. 2. Plots of two rows on the CCDs after running the Bias object on a representative solar frame.
The debiased frames will have an ADU level close to zero in the areas near the reference rectangles. Figure 2 shows this; the red and blue lines are plots of two rows on the CCDs that bisect the reference rectangles. As expected, the baseline is near zero. The lumps in the red plot are where the curving echelle orders run off the edge of the frame. The rise in the blue ADU level toward longer wavelengths (i.e., to the right) appears to be either a broad scattered light source or general gain variation on that side of the CCD. This rise was noted by observers in the very early initial observations with the SSS (in the late 1980s, prior to the present program and reduction methods). In any case it is removed during construction of the scattered light surface later in the reduction procedure. (An additional, diffuse scattered light component as well as some dark current is also likely present and being removed in this debiasing step; see below.)
General debias results: solar data
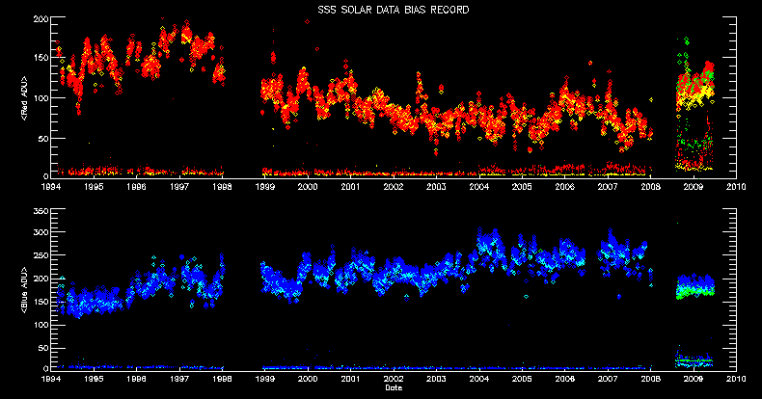
Figure 3 below shows the output of our IDL method SSS::bias_results for our solar data frames. This shows the mean ADU level in the spectrum-free region of the CCD (plotted with diamonds), and its standard deviation (dots), for 4,962 raw solar data frames obtained between January 1, 1994, and October 31, 2008. The gap in 1998 results from a backup failure that led to loss of our raw solar data frames for that period (the reduced spectra were not lost, fortunately). The gap in 2008 is our down time during ordering and installation of the new CCDs. Echelle bias levels are shown in the upper panel, HK bias levels in the lower panel. Solar, flat field, and ThAr frames are shown by red/yellow/green and blue/light blue/green points in the panels, respectively. For visibility on the plot, the dots showing the standard deviation of the data values within the reference rectangles are exaggerated by a factor of 10.

Fig. 3. Record of the background ADU level for all solar data, 1994-2008.
General debias results: stellar data
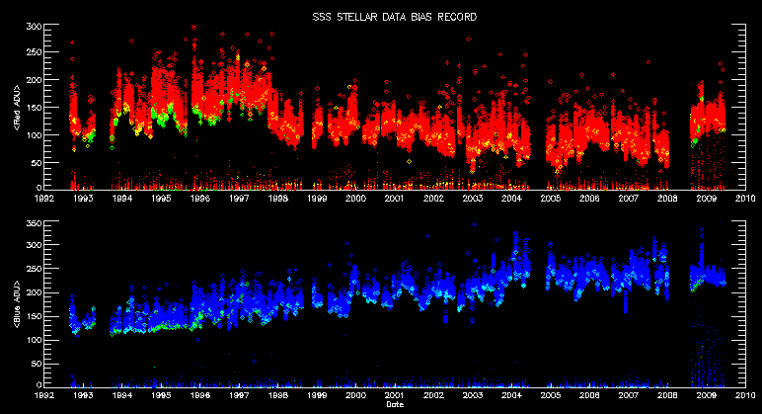
Figure 4 below shows the output of SSS::bias_results for 21,448 stellar frames obtained between January 1, 1994, and October 31, 2008. The gap in 2008 is our down time during ordering and installation of the new CCDs. Echelle bias levels are shown in the upper panel, HK bias levels in the lower panel. Smaller gaps reflect down time due to hardware problems and telescope optics upgrades that only affected stellar observing. Symbol and color coding of data is the same as in Figure 3.

Fig. 4. Record of the background ADU level for all stellar data, 1992-2008.
Discussion
Although we describe this step as "debiasing," in practice, it is a combination of removal of the electronic bias as well as (1) a small amount of global scattered light and (2) accumulated dark current for stellar exposures, which are typically of 10-45 minutes.
The second contribution above is apparent in a small positive correlation between exposure length and minimum observed bias level. The importance of the first is less clear, since we observe no significant correlation between bias and exposure length from one observation to the next The collimated beams in the spectrograph do slightly overfill the gratings, however, so diffuse scattered light is certainly present. The debias results plotted above provide some measure of both its severity as well as its evolution over time. The two cameras are shielded by baffles, so the fact that their long-term drift in the data series above differs is not implausible.
Investigation of background profiles obtained by the scattered light removal methods, as well as examination of full-frame biases (zero-second exposures of the CCDs) does show that the reference rectangles identified in Figure 1 above represent the best spectrum free areas of the frames, and that no part of any individual frame ends up being oversubtracted by the debias object.
Continue to a description of order map creation.

[Back to contents]
[ Back to my home page | Email me: jch [at] lowell [dot] edu ]
The SSS is publicly funded. Unless explicitly noted otherwise, everything on this site is in the public domain.
If you use or quote our results or images, we appreciate an acknowledgment.
This site is best viewed with Mozilla Firefox.