The Solar-Stellar Spectrograph
[ Home | About | Tech Info & Data | Publications | References ] [ Site by Jeffrey Hall | Research funded by NSF ]
Wavelength calibration
Our detectors, of course, do not know what wavelength of light happens to fall on a particular pixel, but we need to know that in order to correctly identify spectral lines and measure activity in precise spectral ranges. We do this step separately from the rest of the reduction, using spectra of a Thorium-Argon hollow cathode. This is a lamp that produces bright emission lines whose wavelengths are known precisely. From the pattern of lines in each order of the spectrum, along with the known wavelengths, we can fit a wavelength solution to the entire spectrum. This solution provides the wavelength reference we then apply to the solar and stellar spectra..
Thorium-Argon wavelength calibration
In general, velocity information is not critical to our solar-stellar variations work; in fact, our normal procedure is to zero the velocity of every spectrum to rest wavelength when we create the spectrum stacks. However, wavelength solutions are essential to some of our work (e.g., binaries), and are generally useful in assessing the stability of the system.
Procedure
The standard procedure is to extract ThAr frames to spectra along with all the others. Since there is no point to applying the continuum normalization to ThArs, however, the solar and stellar reduction methods skip that step for the ThArs only. The SSS class then provides a method make_wavecal that fits second-order polynomials to the set of emission lines in each order. We have created reference files for both the old and new cameras that contain the pixels and wavelengths of each useful line (a rather tedious but one-time chore), and the method simply goes through each order and saves both the fitted wavelengths and the coefficients that generated them. Both the coefficients and the fits are saved to the resource directory.
We do not store our final spectra with the wavelength information attached (i.e., as 512 x N x 2 data files), but rather as just the intensities (512 x N). When analysis requiring wavelength information is needed, we load the appropriate ThAr solution.

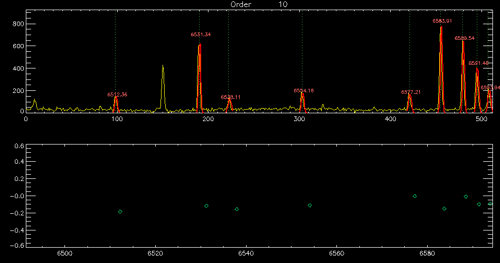
Fig. 1. A sample fit to the Hα order of our ThAr spectrum.
Sample solution
Figure 1 shows one example of a typical wavelength solution, for the Hα order of our new cameras. The upper panel shows the ThAr spectrum in yellow and the fits to the emission lines we can confidently identify from Daryl Willmarth's atlas in red. The bottom panel shows the residuals of the Gaussian centroid fits to the line. For this order, the mean difference between the fit and the lab wavelengths is 0.065 ± 0.097 Å.
[Back to contents]
[ Back to my home page | Email me: jch [at] lowell [dot] edu ]
The SSS is publicly funded. Unless explicitly noted otherwise, everything on this site is in the public domain.
If you use or quote our results or images, we appreciate an acknowledgment.
This site is best viewed with Mozilla Firefox.