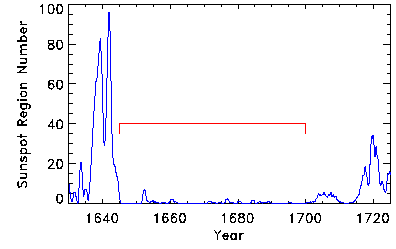

FIGURE 14: Smoothed sunspot region number for 1630 -- 1725. The interval designated as the Maunder Minimum is indicated by a red horizontal bar. (From Hoyt and Schatten (1998).)

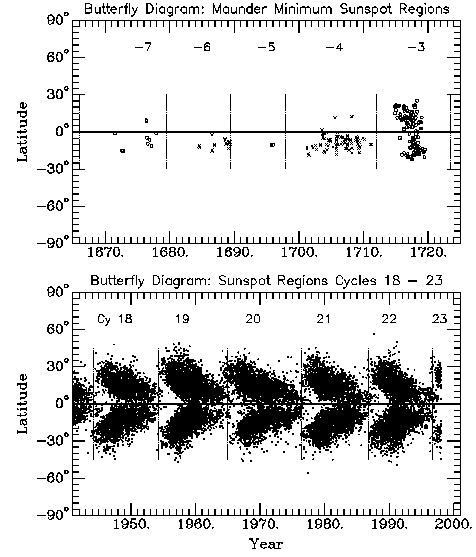
FIGURE 15: The latitude-time plot of sunspot regions observed during the the last half of the Maunder Minimum (Ribes and Nesme-Ribes, 1993) compared with recent cycles. The Paris Observatory record of sunspot positions ended in 1719. The vertical dotted bars indicate the `official' times of cycle minimum.
The alignment of the butterfly diagrams, if correct, suggests that the cycle period during the Maunder Minimum was not too different from that of the higher, more recent cycles, that is, around 11 years. The good match between the phasing of cycles in these two periods suggests that the times of minima in the Maunder Minimum are not too unreasonable. It is curious that most of the activity during this period of the Maunder Minimum occurred in the southern hemisphere.
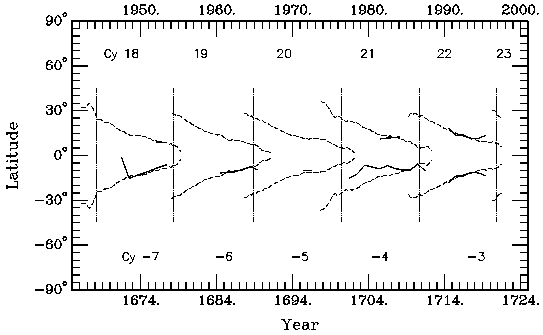
An overlay of the mean latitude of the sunspot regions in the two periods suggests that active regions during the Maunder Minimum first appeared quite late with the cycle period. With the exception of cycle -4, their mean latitude tracked that of current cycles. For Cycle -4, however, the sunspot regions were confined to the latitudes less than 20° and at much lower latitudes compared to more recent higher-amplitude cycles over the first half of this cycle. Perhaps related to this is the finding by Ribes and Nesme-Ribes (1993) that compared to the current differential rotation curve, the rotation rate during the Maunder Minimum was about slower by 2% for sunspots near the equator and by almost 5% for those at 15° latitude. This tendency appears to have persisted into the cycles just after the Maunder Minimum with the near equatorial regions rotating only about 1% slower.

FIGURE 16: Average latitude of Maunder Minimum sunspot regions observed 1666--1719 (heavy solid curve) compared with that of sunspot regions in recent cycles (light dotted curve).}