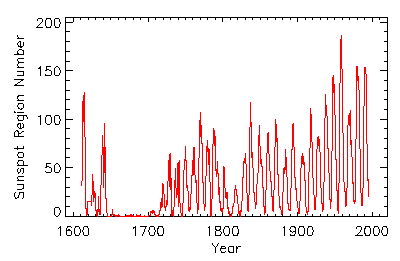

FIGURE 1: Smoothed sunspot region number: 1610 -- 1995. (From Hoyt and Schatten, 1998).
Measurements of the position of sunspot regions and sunspot area, which began in 1874 at the Greenwich Observatory, and of sunspot polarity, beginning in 1917 at Mt. Wilson Observatory, added information on spatial distribution of active regions and how it changes with time. These data, along with intensity images and magnetograms of the Sun over the last few decades, have given us a general picture on the variability of solar activity both in space and time, and clues into the processes that produce the solar cycle. For example, the leader and follower portions of active regions have opposite polarities between the northern and southern hemispheres. These polarities reverse with each successive cycle. Active regions belonging to any one cycle continue to emerge for periods of 12 to 14 years, overlapping in time (2-4 years), although not spatially, with the emergence of regions belonging to the next cycle. Early in a cycle, active region occur at higher latitudes (20-30 degrees). As the cycle progresses, regions appear at systematically lower latitudes, emerging in a band close to the equator by the end of a cycle. Active regions on average emerge with the leader positioned slightly closer to the equator than the follower. The tilt of active regions is an important factor in the reversal of the polar fields, which occurs during the maximum phase of a cycle. The process of reversal occurs as magnetic flux from dispersing active regions migrates toward and into the polar regions, replacing the existing magnetic fields in the rise of a cycle and augmenting them in the decline of the cycle.
The solar cycle is thought to have its origins at the base of the convection zone (e.g. Rabin et al., 1991; Zwaan, 1996; and references therein). The classical picture is of a poloidal magnetic field of the Sun that is stretched and wound into toroidal flux ropes by differential rotation. This process amplifies the sub-surface fields, giving rise to buoyant magnetic flux loops, which rise to the surface. Helioseismology has provided a probe of the characteristics of solar interior, e.g., the variation in temperature, rotation rate, and other velocity flows, as a function of depth and latitude. To date, however, the sub-surface magnetic structures that eventually emerge at the surface as active regions have not yet been reliably detected within or below the convection zone. Our understanding of the solar cycle, therefore, is based primarily on observations of phenomena occurring in and above the photosphere, phenomena that are a direct result of magnetic fields emerging from the interior through the surface.
The observations currently available of the various manifestations of solar activity from the photosphere to the corona only cover the last 2 to 3 solar cycles. This circumstance makes it difficult to investigate the full range of solar activity, from Maunder Minimum conditions to those even higher than we have experienced in recent decades, and the processes that produce this cyclic behavior both on short- and long-time scales. One important avenue of research directed toward this problem is the study of solar-like stars that also show activity cycles. Such studies provide a powerful tool for investigating the characteristics of activity cycles over a wide range of stellar chemical compositions, convection zone depths, rotation rates, masses, and ages. To place the Sun in the context of these stars, however, it is crucial to understand the amplitude, time scale and source of its variability.
The objective of this paper is to provide an overview of the observed properties of the solar activity cycle as an introduction to the broader study of activity cycles in stars. It will examine observations of the total and spectral irradiance variations of the Sun in the visible wavelengths and infrared wavelengths and what the source of these variations is (Section 2), the spatial distribution of solar activity on a time-scale of a few solar rotations to that of a cycle (Section 3), and a comparison between activity observed during the Maunder Minimum and in current cycles (Section 4).