Observations of the Sun at Ultraviolet Wavelengths: 1 to 400 nm
Gary Rottman
Laboratory for Atmospheric and Space Physics
University of Colorado, Boulder, CO 80309-0590
gary.rottman@maia.colorado.edu
Abstract
The solar spectrum peaks in the visible and is well represented as a
black-body spectrum with an effective temperature near 6000 K. As we
move from visible to ultraviolet wavelengths the radiation originates
higher in the solar atmosphere: radiation at 400 nm originates near
the base of the solar photosphere, at 200 nm near the top of the
photosphere, from 100 to 160 nm from the chromosphere, and less than
100 nm from the transition region and corona. Examining radiation
from higher and higher layers of the solar atmosphere, the variation
steadily increases from far less than 1% at wavelengths longward of
300 nm, 10's of percent from 100 to 200 nm, and exceeding an order of
magnitude at the short EUV and X-ray wavelengths. Such variability is
now documented over all time scales: short- to intermediate-term
variations, usually associated with the appearance and disappearance
of active regions and modulated by the 27-day rotation of the Sun, to
the much longer 11-year solar cycle variations.
1. Introduction
Solar radiation spans the entire electromagnetic spectrum
from the shortest X-rays to long-wavelength radio waves. However, by
far the greatest amount of the radiation falls in the visible, and the
shape of the solar spectrum is quite similar to a black-body spectrum
for an effective temperature near 6000 K, peaking near 500 nm. Figure
1 illustrates the solar spectrum from 200 nm in the ultraviolet to 2
\mu in the near infrared - the integral of this spectrum accounts for
roughly 94% of the radiant energy from the Sun. The smooth curve
overlying this solar spectrum is the spectrum of a black-body with a
temperature of 5770 K (simplified and without limb-darkening
effects). The solar spectrum is quite smooth and continuous longward
of its peak, but at the shorter wavelengths it is jagged and displays
numerous absorption features, both lines and edges. The source of the
emission of Figure 1 is diverse, with the visible originating in the
lower photosphere. Moving to shorter and shorter wavelengths the
emission comes from higher and higher layers of the solar atmosphere.
The most comprehensive picture of the solar spectrum comes from the
theory of stellar atmospheres, which uses opacity in establishing the
shape of the spectrum of a star such as the Sun. The profusion of
spectral lines and free-bound absorption edges of neutral metals
(e.g., iron and titanium) provide structure to the solar spectrum,
especially at wavelengths short of 400 nm.
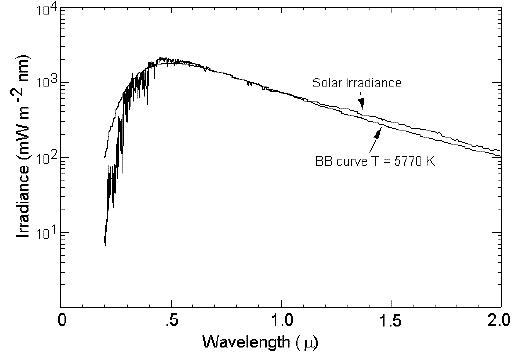
FIGURE 1: The
solar irradiance spectrum from 0.2 \mum to 2 \mum. The
smooth curve superposed is a black-body spectrum with an effective
temperature of 5770 K.
When the Sun is observed
from the ground, roughly half of the radiation has already been
absorbed or scattered away by the atmosphere. Ozone is completely
effective in removing all radiation short of 300 nm, and longward of
about 1 \mum large segments of the spectrum are removed by atmospheric
water vapor. These and other absorbers, coupled with clouds and
aerosols, are quite variable and preclude any hope of detecting from
the ground changes in solar radiation unless the variation is quite
large - say on the order of several percent. It is for these reasons
that early attempts to establish solar variability were quite
unsuccessful, and it was only with the advent of long-duration space
missions that the first true measures of solar variability have now
been achieved. Measurements from several spacecraft now span almost
two complete solar cycles and from these we infer that the total solar
irradiance, at least for the two most recent solar cycles, only
changes on the order of 0.1%, certainly with some shorter term
variations of a few times this value. The reader is referred to the
observations that have been reported for the ERB instrument on
NIMBUS-7 (Kyle at al., 1993), the ACRIM instruments on SMM and UARS
(Willson, 1994), the ERBS instrument on the ERBE satellite (Lee,
1995), the VIRGO instrument on SOHO (Frö hlich, 1994), and several
others.
For this discussion we will consider the record of total solar
irradiance (TSI) only in the context of its constraint on the spectral
measurements at ultraviolet wavelengths. That is, if we consider that
the TSI varies by 0.1% we infer that the spectral band short of 400
nm, about 10% of TSI, cannot vary by more that 1% - or it would
account for the entirety of the TSI variation. Likewise the band short
of 300 nm, about 1% of TSI, cannot vary more that 10%. The following
discussion will carefully consider what we presently know about the
variation of the Sun in the ultraviolet, and what is yet to be
measured and learned.
2. Observations
The measurement of TSI had to be moved into space for the
reason that its variation was much less than 1%, so
small that it is masked by atmospheric effects as seen from the
ground. Observations of the solar ultraviolet, on the other hand, can
only be made from above the atmosphere, and therefore, these
measurements were not even possible until the 1950's. In fact, the
first twenty or so years of sporadic sounding rocket observations,
some with film, some with photoelectric detectors, provide only meager
information at a few select wavelengths (see White, 1977). It has
only been during the past twenty years, from the peak of solar cycle
21 in 1979, through solar minimum in 1986, and through the entire
solar cycle 22 that we now have measurements which piece together to
provide a view of the ultraviolet Sun and its variation.
Figure 2
shows the ultraviolet portion of the solar spectrum from 120 to 420 nm
that extends the data of Figure 1 (note that
109 mW m-3 of Figure 2
corresponds to 103 mW m-2 nm-1 of Figure 1). This spectrum has been
integrated to 1 nm spectral bins (effective resolution of 1 nm) but
quite adequately illustrates the structure in the spectrum: the
Fraunhofer absorption lines illustrated by the Mg II doublet near 280
nm, the typical absorption edges seen for example at 208 nm due to Al
I, and the conversion to an emission line spectrum at the shortest
wavelengths - notably Lyman \alpha at 122 nm. In this spectral range we
comment on these various features, for they become quite apparent when
we examine solar variability discussed in the next section.
<

FIGURE 2:The
solar ultraviolet irradiance from 120 to 420 nm at 1 nm
effective spectral resolution.
The very shortest wavelengths, the extreme ultraviolet and X-rays, are
not considered specifically in this discussion. This high-energy
portion of the solar spectrum is dominated by emission lines
originating in the solar transition region and corona, and as such it
is highly variable. In the context of TSI - it is negligible, in the
context of the Earth's atmosphere - it is especially important to the
thermosphere and ionosphere above 100 km, in the context of stellar
connections - it is of special relevance down to the Lyman edge at 91
nm and at the very short wavelengths where the interstellar medium
once again becomes transparent. Unfortunately observation of the EUV
Sun are quite sparse, especially during the past twenty years. AE-E
(Hinteregger et al. 1981) observed the Sun from 1977 to 1981, but
other than a few sounding rockets and the short duration San Marco
satellite, no further observations have been forthcoming. This gap in
the data set and in our knowledge of the Sun will be addressed by the
SEE instrument (Woods, et al. 1994) to be flown on the TIMED mission
with a launch in the year 2000. The Yohkoh satellite has provided
irradiance observations at 4 to 40 A since mid-1991 (Acton, 1996)
and recent SOHO observations will provide limited irradiance
measurements from late 1995 forward.
The longer wavelength spectrum
of the Sun, in particular the spectral interval 120 to 400 nm, is now
quite well studied. A number of instruments have provided, and
continue to provide, spectra similar to that shown in Figure 2. Solar
Backscatter Ultraviolet Instruments, SBUV, have been flow continuously
since late 1978, first on the Nimbus-7 satellite and subsequently on a
number of NOAA satellites (Cebula et al. 1994). These instruments
operate in the spectral range 160 to 400 nm with a spectral resolution
of about 1 nm. The Solar Mesosphere Explorer (SME) operated from 1981
through early 1989 and covered the spectral range 120 to 300 nm with a
spectral resolution of 0.75 nm. More recently two instruments have
operated on the Upper Atmosphere Research Satellite (UARS) since 1991.
These two instruments, the Solar Ultraviolet Spectral Irradiance
Monitor, SUSIM (Brueckner, et al. 1993) and the Solar Stellar
Irradiance Comparison Experiment, SOLSTICE, (Rottman et al. 1993),
have provided continuous coverage in the spectral range 120 to 420 nm
with a spectral resolution varying from 0.1 to 1 nm. The GOME
instrument on the European ERS-2 spacecraft (ESA, GOME Users Maual,
1995) has been operational since mid-1995, and covers the spectral
range 240 nm all the way to 790 nm. Woods et al. (1996) provide a
very detailed comparison and validation of simultaneous observations
obtained on two separate occasions by four separate instruments, the
two on UARS and a SUSIM and SSBUV instrument flown on the Shuttle.
This analysis implies that spectra as shown in Figure 2 are now known
to an absolute accuracy (irradiance relative to the SI scale) of 2 to
5% (wavelength dependent with larger uncertainty toward the shorter
wavelengths). The reader is referred to the Woods et al. (1996)
article for a full discussion and a tabulation of the irradiance
values.
3. Solar Variability
The present state of our understanding of the solar
irradiance in absolute units, that is on a scale related to the SI
standard of irradiance, has an uncertainty of approximately 2 to 5%.
The reality of this fact is that if we compare two different
observations of the Sun, from two different instruments, they may
provide an estimate of true solar variability with an uncertainty of
roughly 3 to 7%. This may be sufficient, although not altogether
desirable, at certain wavelengths where the variation is much larger
than these numbers. For example, such a capability would suffice at
Lyman \alpha where the solar cycle variation is about a factor of two. But
such comparisons would be completely inadequate, providing ambiguous
information near 200 nm where the solar cycle variation is only on the
order of 10%. Therefore, our inability to calibrate irradiance
instruments better than a few percent, limits the usefulness of
intercomparing data sets from different instruments. Nevertheless, we
have been fortunate in establishing long-term solar variations by
using data from single instruments. As long as the observations
continue for periods of several years, and as long as there is a
credible technique to account for changes in the instrument
sensitivity; then the data comparison becomes straightforward. For if
we compare data from a single instrument, the ratio of any two
measurements causes many terms to cancel - the area of the entrance
aperture probably has not changed, the wavelength bandpass of the
spectrometer likely has not changed, and so forth. The confidence in
the amount of variation attributed to the Sun is related to the time
base between the two measurements, and as mentioned above, to our
ability to track changes in instrument sensitivity. Since 1978, the
handful of instruments described above, ranging from the NIMBUS-7
SBUV to the present day UARS and ERS-2 instruments, have provided
precise measurements accurate to perhaps a few tenths of a percent
over time bases of two to three weeks, and one to two percent over
time bases of several years.
3.1. 27-day Variations
One of the dominant signals of solar variation is
related to the 27-day rotation period of the Sun. As active regions
appear and disappear on the solar disk, their occurrence is
non-uniform. The resulting irregular distribution provides a striking
signal modulated at the rotation period of the Sun. The amplitude of
the signal is dependent on the summed strength of the activity on one
side of the Sun, opposed by the signal on the other. This implies
that in the unlikely occurrence of a near uniform distribution of
activity, the 27-day signal could be quite small even for a very
active Sun. Likewise, for a very non-uniform distribution - an active
hemisphere and a quiet hemisphere could provide a strong 27-day signal
even at moderate solar activity. Figure 3 is a typical variation of
the Sun during a 27-day period (i.e., measurements separated by
roughly 13 days) shown as a function of wavelength. The ratio is
plotted twice, once for the scale at the left and then magnified by a
factor of ten for the scale to the right. Notice how details of this
curve correspond with the spectral features of Figure 2. All of the
strong emission lines at the blue end of the spectrum have much higher
variability than their neighboring "continuum." As our attention
moves across the aluminum edge at 208 nm, the variation drops by a
factor of two. The amplitude of the 27-day variation continues to
fall toward longer wavelength, becoming only a small fraction of a
percent with the exception of the strong Fraunhofer lines of Mg II at
280 nm and Ca II at 390 nm. In fact, we notice that longward of about
300 nm the variation becomes negative. That is, the "active" phase is
now dimmer than the "inactive" phase. This is reminiscent of
measurements of TSI where often the more active Sun is accompanied by
large sunspots which block more radiation than can be filled in by the
surrounding bright faculae. Thereby, the ratio of the two irradiance
values falls below "one," and we see the spectral signature of the
"sunspot blocking" phenomenon. It should be noted that the 27-day
variation shown in Figure 3 is typical, but by no means standard.
Each rotation of the Sun will most likely provide a magnitude, and
perhaps a shape, different from that shown in this figure.
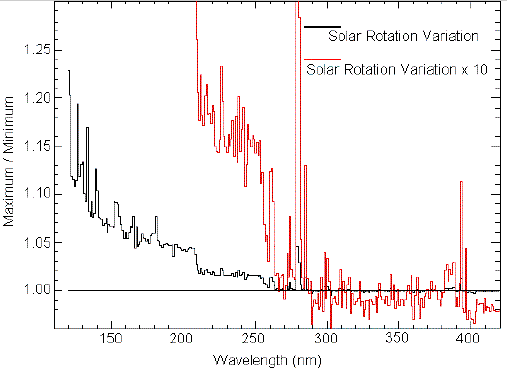
FIGURE 3: The
amplitude of a 27-day variation of the Sun shown as a
function of wavelength. This curve corresponds to a single rotation
period in early 1992. Although this curve is typical of the 27-day
modulation of solar radiation, it should not be considered "standard"
in either amplitude or shape.
3.2. Solar Cycle Variations
As we extend our observations of the Sun over
a longer and longer time base, we hope to establish correspondingly
longer time scales of solar variability. If a single instrument has
been used to make the measurements, we must establish any and all
changes in the instrument sensitivity before we can extract from the
data the inherent variation in the Sun. The two UARS instruments,
SOLSTICE and SUSIM, were both designed with the specific goal of
measuring long-term solar variations. SUSIM uses standard lamps as
in-flight calibration source; and moreover, it uses redundant lamps
and optical channels to confirm all instrument changes. SOLSTICE uses
a completely different calibration technique relying on bright blue,
early-type stars as in-flight calibration standards. This unique
approach relies on the assumption that the stars are very stable
(inherent variability of a small fraction of one percent over time
periods of thousands of years), and that the ensemble average of
twenty or so stars form an even more stable reference standard. The
validation paper by Woods et al. (1996) documents the initial
comparisons of these two instruments, and additional comparisons are
in progress. Both techniques appear to work well, and the six and one
half year data record from either, or both instruments will be
accurate to better than one percent. The UARS time period spans
conditions from near solar maximum in early 1992 through solar minimum
in 1996, and now on toward the next solar maximum. Both instruments
together with the entire UARS spacecraft are working well, and there
is every reason to believe that the mission will continue through the
maximum of cycle 23. Figure 4 provides a preliminary estimate to the
solar cycle variation from early 1992 to late 1996. Similar to Figure
3, it is the ratio of the maximum Sun to the minimum Sun, and it is
interesting to see the similarity of this curve to the rotational
variation of Figure 3. We note the strong variation - as much as a
factor of two in Lyman \alpha and in the other strong chromospheric lines
short of 140 nm, and generally stronger than the neighboring
continuum. The amount of variability steadily decreases toward longer
wavelengths where again we see a drop of about a factor of two moving
across the aluminum edge at 208 nm. At the present time we feel that
these data sets have a precision and relative accuracy (uncertainty in
the ratio of two values) limited at one to two percent, and therefore
as we move toward longer wavelengths, especially at 250 nm and above,
we are becoming limited by the observations. It is encouraging to see
the Mg II doublet at 280 nm rising from the noise floor, but as we
move on to 300 nm and above the present state-of-the-art is just not
up to the task of resolving true solar variability. Both the SUSIM
and SOLSTICE Science Teams continue to refine their data processing
algorithms, and we are optimistic that in the final analysis the
detection limit for solar variability will be at, or slightly better
than, the one percent level. This precision and relative accuracy
will hopefully be adequate to establish solar variability at
wavelengths less than 300 nm. At wavelengths longward of 300 nm it
appears that the solar variation will remain hidden below our present
detection limits, and will await the next generation of solar
irradiance techniques.
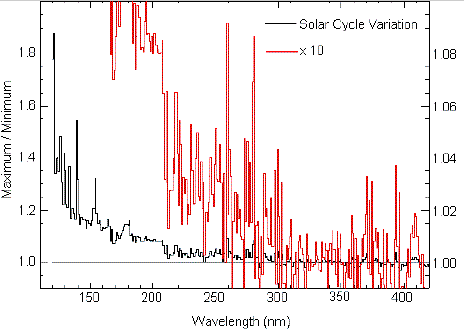
FIGURE 4: The
amplitude of solar cycle variation (early 1992 divided
by 1996) as a function of wavelength. Estimate of the uncertainty in
this ratio is 1 to 2%, and there is presently only an upper limit
(<1%) of solar cycle variations at wavelengths longer than about 300 nm.
3.3. Flare Enhancements
Short-term solar variations in particular
flares are very dramatic when observed in the ultraviolet, and these
transient occurrences have important stellar counterparts. Brekke et
al. (1996) discuss an observation of a Class 3B solar flare for which
the emitted flux density from the entire solar disk increased by more
than an order of magnitude for many of the chromospheric emission
lines in the spectral range 120 to 170 nm. Such a flare phenomenon
would be easily detected in other stars. For example, if a star is
observed in the Si IV line at 139 nm during the impulsive phase
(approximately 5 minutes) of a large stellar flare, its brightness may
be expected to rise a factor of ten or more.
4. Future Observing Programs
We now have a record of the variation of total solar irradiance, and
of the variation of its ultraviolet spectral component, over two
complete solar cycles. However these observations represent only a
snapshot of the long term behavior of the Sun, and it is essential
that such measurements be continued. This extended data base will
allow us to more fully understand the nature of the Sun and the
physically processes underlying its variability. However, the
spectral knowledge that we have of solar variability is limited to
wavelengths short of 300 nm. In the visible and near infrared we can
place upper limits on solar variability, limits set for the most part
by observations of total solar irradiance. Since TSI varies only on
the order of 0.1%, it is difficult to reconcile spectral changes much
different than this value. It is just as unlikely that the spectral
character of the variations is "white" and invariant in wavelength.
Theories and modeling of solar radiation speak to a structured solar
variation, and to address and constrain such theories will require
visible and near infrared observations. The reason that more is
presently known about the ultraviolet variability is not that the UV
measurements are better, but only that their solar variations are so
much larger. Past spectral observations have been up to the task of
measuring one to a few percent changes, but they not been able to
record long term changes at the fraction of a percent level. This is
the challenge for future observations, and techniques based on
super-sensitive electrical substitution radiometers (ESR's) will soon
be applied to these observations. The next generation of irradiance
instruments should provide the spectral details underlying the envelope
of the TSI.
References
Acton, L. W., 1996, in "Proceedings of the
9th Cambridge Workshop on Cool Stars, Stellar Systems and the Sun,''
ed. R. Pallavicinni and A. Dupree, (Provo: Astron. Soc of Pacific)
Brekke, P., Rottman, G. J., Fontenla, J., & Judge, P. G. 1996,
ApJ, 468, 418.
Brueckner, G.E., Edlow, K. L.,
Floyd, L. E., Lean, J. L., & VanHoosier, M. E.
1993, JGR, 98, 10695.
Cebula, R. P., Hilsenrath, E., & Deland, M. T. 1994, in
"The Sun as a Variable Star,''
eds. J. M. Pap, C. Frölich, H. S. Hudson, and S. K. Solanki,
(Cambridge: Cambridge), p. 81.
Frölich, C., and the VIRGO team: 1996, "First Results from the
VIRGO Experiment, Transactions AGU, Spring Meeting.
Kyle, H.L., Hoyt, D. V., Hickey, J. R., Maschoff, R. H., & Vallette, G. J. 1993,
"Nimbus-7 Earth Radiation Budget Calibration History - Part 1: The
solar channels", NASA Reference Publication 1316.
Lee, R.B.,
Gibson, M. A., Wilson, R. S., & Thimas, S. 1995, JGR, 100, 1667.
Rottman, G. J., Woods, T. N., & Sparn, T. P. 1993, JGR, 98, 10667.
White, O. R.,
1977, The Solar output and its Variation (Boulder: Colorado)
Willson, R. C. 1994, in
"The Sun as a Variable Star,''
eds. J. M. Pap, C. Frölich, H. S. Hudson, and S. K. Solanki,
(Cambridge: Cambridge), p. 54.
Woods, T. N.,
Rottman, G. J., Roble, R. G., White, O. R., Solomon, S. C.,
Lawrence, G. M., Lean, J., & Tobiska, W. K. 1994, "TIMED Solar EUV
Experiment,'' SPIE Proceedings, 2266, 467.
Woods, T. N.,
Prinz, D. K., Rottman, G. J., London, J., Crane, P. C., Cebula, R. P.,
Hilsenrath, E. Brueckner, G. E., Andrews,M. D., White, O. R.,
VanHoosier, M. E., Floyd, L. E., Herring, L. C., Knapp, B. G.,
Pankratz, C. K., & Reiser, P. A., 1996, JGR, 101, 9541.