Observations of the Sun at Ultraviolet Wavelengths: 1 to 400 nm
Gary Rottman, Laboratory for Atmospheric and Space Physics
3. Solar Variability
The present state of our understanding of the solar
irradiance in absolute units, that is on a scale related to the SI
standard of irradiance, has an uncertainty of approximately 2 to 5%.
The reality of this fact is that if we compare two different
observations of the Sun, from two different instruments, they may
provide an estimate of true solar variability with an uncertainty of
roughly 3 to 7%. This may be sufficient, although not altogether
desirable, at certain wavelengths where the variation is much larger
than these numbers. For example, such a capability would suffice at
Lyman alpha where the solar cycle variation is about a factor of two. But
such comparisons would be completely inadequate, providing ambiguous
information near 200 nm where the solar cycle variation is only on the
order of 10%. Therefore, our inability to calibrate irradiance
instruments better than a few percent, limits the usefulness of
intercomparing data sets from different instruments. Nevertheless, we
have been fortunate in establishing long-term solar variations by
using data from single instruments. As long as the observations
continue for periods of several years, and as long as there is a
credible technique to account for changes in the instrument
sensitivity; then the data comparison becomes straightforward. For if
we compare data from a single instrument, the ratio of any two
measurements causes many terms to cancel - the area of the entrance
aperture probably has not changed, the wavelength bandpass of the
spectrometer likely has not changed, and so forth. The confidence in
the amount of variation attributed to the Sun is related to the time
base between the two measurements, and as mentioned above, to our
ability to track changes in instrument sensitivity. Since 1978, the
handful of instruments described above, ranging from the NIMBUS-7
SBUV to the present day UARS and ERS-2 instruments, have provided
precise measurements accurate to perhaps a few tenths of a percent
over time bases of two to three weeks, and one to two percent over
time bases of several years.
3.1. 27-day Variations
One of the dominant signals of solar variation is
related to the 27-day rotation period of the Sun. As active regions
appear and disappear on the solar disk, their occurrence is
non-uniform. The resulting irregular distribution provides a striking
signal modulated at the rotation period of the Sun. The amplitude of
the signal is dependent on the summed strength of the activity on one
side of the Sun, opposed by the signal on the other. This implies
that in the unlikely occurrence of a near uniform distribution of
activity, the 27-day signal could be quite small even for a very
active Sun. Likewise, for a very non-uniform distribution - an active
hemisphere and a quiet hemisphere could provide a strong 27-day signal
even at moderate solar activity.
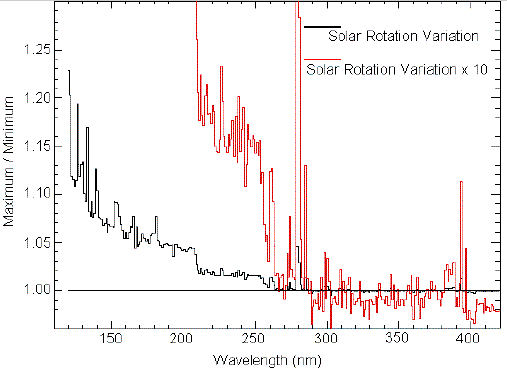
Figure 3 is a typical variation of
the Sun during a 27-day period (i.e., measurements separated by
roughly 13 days) shown as a function of wavelength. The ratio is
plotted twice, once for the scale at the left and then magnified by a
factor of ten for the scale to the right. Notice how details of this
curve correspond with the spectral features of Figure 2. All of the
strong emission lines at the blue end of the spectrum have much higher
variability than their neighboring "continuum." As our attention
moves across the aluminum edge at 208 nm, the variation drops by a
factor of two. The amplitude of the 27-day variation continues to
fall toward longer wavelength, becoming only a small fraction of a
percent with the exception of the strong Fraunhofer lines of Mg II at
280 nm and Ca II at 390 nm. In fact, we notice that longward of about
300 nm the variation becomes negative. That is, the "active" phase is
now dimmer than the "inactive" phase. This is reminiscent of
measurements of TSI where often the more active Sun is accompanied by
large sunspots which block more radiation than can be filled in by the
surrounding bright faculae. Thereby, the ratio of the two irradiance
values falls below "one," and we see the spectral signature of the
"sunspot blocking" phenomenon. It should be noted that the 27-day
variation shown in Figure 3 is typical, but by no means standard.
Each rotation of the Sun will most likely provide a magnitude, and
perhaps a shape, different from that shown in this figure.

FIGURE 3: The
amplitude of a 27-day variation of the Sun shown as a
function of wavelength. This curve corresponds to a single rotation
period in early 1992. Although this curve is typical of the 27-day
modulation of solar radiation, it should not be considered "standard"
in either amplitude or shape.
3.2. Solar Cycle Variations
As we extend our observations of the Sun over
a longer and longer time base, we hope to establish correspondingly
longer time scales of solar variability. If a single instrument has
been used to make the measurements, we must establish any and all
changes in the instrument sensitivity before we can extract from the
data the inherent variation in the Sun. The two UARS instruments,
SOLSTICE and SUSIM, were both designed with the specific goal of
measuring long-term solar variations. SUSIM uses standard lamps as
in-flight calibration source; and moreover, it uses redundant lamps
and optical channels to confirm all instrument changes. SOLSTICE uses
a completely different calibration technique relying on bright blue,
early-type stars as in-flight calibration standards. This unique
approach relies on the assumption that the stars are very stable
(inherent variability of a small fraction of one percent over time
periods of thousands of years), and that the ensemble average of
twenty or so stars form an even more stable reference standard. The
validation paper by Woods et al. (1996) documents the initial
comparisons of these two instruments, and additional comparisons are
in progress. Both techniques appear to work well, and the six and one
half year data record from either, or both instruments will be
accurate to better than one percent. The UARS time period spans
conditions from near solar maximum in early 1992 through solar minimum
in 1996, and now on toward the next solar maximum. Both instruments
together with the entire UARS spacecraft are working well, and there
is every reason to believe that the mission will continue through the
maximum of cycle 23.
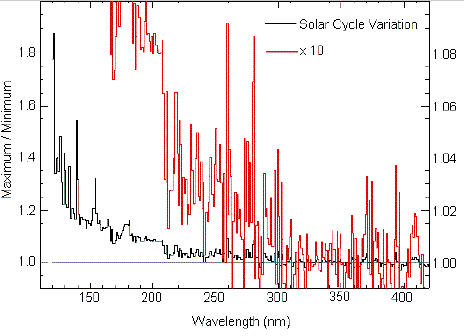
Figure 4 provides a preliminary estimate to the
solar cycle variation from early 1992 to late 1996. Similar to Figure
3, it is the ratio of the maximum Sun to the minimum Sun, and it is
interesting to see the similarity of this curve to the rotational
variation of Figure 3. We note the strong variation - as much as a
factor of two in Lyman alpha and in the other strong chromospheric lines
short of 140 nm, and generally stronger than the neighboring
continuum. The amount of variability steadily decreases toward longer
wavelengths where again we see a drop of about a factor of two moving
across the aluminum edge at 208 nm. At the present time we feel that
these data sets have a precision and relative accuracy (uncertainty in
the ratio of two values) limited at one to two percent, and therefore
as we move toward longer wavelengths, especially at 250 nm and above,
we are becoming limited by the observations. It is encouraging to see
the Mg II doublet at 280 nm rising from the noise floor, but as we
move on to 300 nm and above the present state-of-the-art is just not
up to the task of resolving true solar variability. Both the SUSIM
and SOLSTICE Science Teams continue to refine their data processing
algorithms, and we are optimistic that in the final analysis the
detection limit for solar variability will be at, or slightly better
than, the one percent level. This precision and relative accuracy
will hopefully be adequate to establish solar variability at
wavelengths less than 300 nm. At wavelengths longward of 300 nm it
appears that the solar variation will remain hidden below our present
detection limits, and will await the next generation of solar
irradiance techniques.

FIGURE 4: The
amplitude of solar cycle variation (early 1992 divided
by 1996) as a function of wavelength. Estimate of the uncertainty in
this ratio is 1 to 2%, and there is presently only an upper limit
(< 1%) of solar cycle variations at wavelengths longer than about 300 nm.
3.3. Flare Enhancements
Short-term solar variations in particular
flares are very dramatic when observed in the ultraviolet, and these
transient occurrences have important stellar counterparts. Brekke et
al. (1996) discuss an observation of a Class 3B solar flare for which
the emitted flux density from the entire solar disk increased by more
than an order of magnitude for many of the chromospheric emission
lines in the spectral range 120 to 170 nm. Such a flare phenomenon
would be easily detected in other stars. For example, if a star is
observed in the Si IV line at 139 nm during the impulsive phase
(approximately 5 minutes) of a large stellar flare, its brightness may
be expected to rise a factor of ten or more.
[First | Prev | Next ]
[Contents]


