Laboratory Measurement of Volatile Ice Vapor Pressures with a Quartz Crystal Microbalance
Published in 2024 in Icarus 410 115767. DOI: 10.1016/j.icarus.2023.115767
W.M. Grundy1,2, S.C. Tegler2, J.K. Steckloff3,4, S.P. Tan3, M.J. Loeffler2,5, A.V. Jasko6,2, K.J. Koga1,2, B.P. Blakley2,7, S.M. Raposa2, A.E. Engle2, C.L. Thieberger2, J. Hanley1,2, G.E. Lindberg8,5, M.D. Gomez2, A.O. Madden-Watson2
(1) Lowell Observatory, Flagstaff AZ.
(2) Department of Astronomy and Planetary Science, Northern Arizona University, Flagstaff AZ.
(3) Planetary Science Institute, Tucson AZ.
(4) Department of Aerospace Engineering and Engineering Mechanics, University of Texas at Austin, Austin TX.
(5) Center for Material Interfaces in Research and Applications, Northern Arizona University, Flagstaff AZ.
(6) Case Western Reserve University, Cleveland OH.
(7) Pasadena City College, Pasadena CA.
(8) Department of Chemistry and Biochemistry, Northern Arizona University, Flagstaff AZ.
Abstract
Nitrogen, carbon monoxide, and methane are key materials in the far outer Solar System where their high volatility enables them to sublimate, potentially driving activity at very low temperatures. Knowledge of their vapor pressures and latent heats of sublimation at relevant temperatures is needed to model the processes involved. We describe a method for using a quartz crystal microbalance to measure the sublimation flux of these volatile ices in the free molecular flow regime, accounting for the simultaneous sublimation from and condensation onto the quartz crystal to derive vapor pressures and latent heats of sublimation. We find vapor pressures to be somewhat lower than previous estimates in literature, with carbon monoxide being the most discrepant of the three species, almost an order of magnitude lower than had been thought. These results have important implications across a variety of astrophysical and planetary environments.
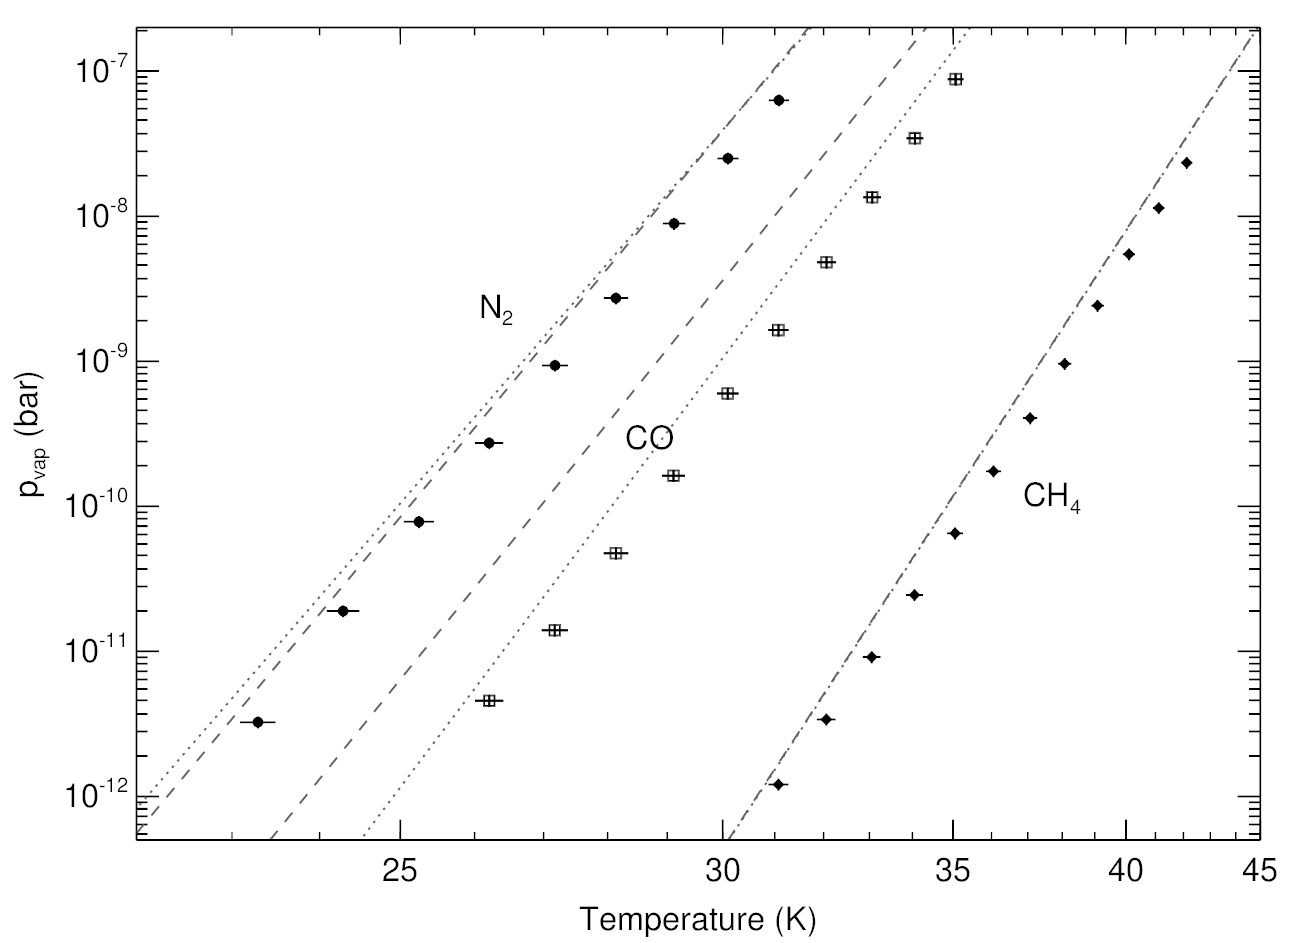
Fig. 3. Our measured vapor pressures (points) compared with polynomial expressions (dashed curves from Fray & Schmitt 2009, dotted curves from Brown & Ziegler 1980). The measured temperatures have been corrected as described in Appendix A, and are plotted on a scale that is linear in 1/T. Vertical error bars represent ±9 % random errors in measured pvap while horizontal error bars represent ±0.2 K systematic uncertainty in measured temperature.