Near-Infrared Spectral Monitoring of Triton with IRTF/SpeX II: Spatial Distribution and Evolution of Ices
Published in 2010: Icarus 205, 594-604.
W.M. Grundy1,2, L.A. Young1,3, J.A. Stansberry4, M.W. Buie3, C.B. Olkin1,3, and E.F. Young1,3
(1) Visiting/remote observer at the Infrared Telescope Facility, operated by the University of Hawaii under Cooperative Agreement NCC 5-538 with the National Aeronautics and Space Administration, Science Mission Directorate, Planetary Astronomy Program.
(2) Lowell Observatory, Flagstaff AZ.
(3) Southwest Research Institute, Boulder CO.
(4) Steward Observatory, University of Arizona, Tucson AZ.
Abstract
This report arises from an ongoing program to monitor Neptune's largest moon Triton spectroscopically in the 0.8 to 2.4 μm range using IRTF/SpeX. Our objective is to search for changes on Triton's surface as witnessed by changes in the infrared absorption bands of its surface ices N2, CH4, H2O, CO, and CO2. We have recorded infrared spectra of Triton on 53 nights over the ten apparitions from 2000 through 2009. The data generally confirm our previously reported diurnal spectral variations of the ice absorption bands (Grundy and Young 2004). Nitrogen ice shows a large amplitude variation, with much stronger absorption on Triton's Neptune-facing hemisphere. We present evidence for seasonal evolution of Triton's N2 ice: the 2.15 μm absorption band appears to be diminishing, especially on the Neptune-facing hemisphere. Although it is mostly dissolved in N2 ice, Triton's CH4 ice shows a very different longitudinal variation from the N2 ice, challenging assumptions of how the two ices behave. Unlike Triton's CH4 ice, the CO ice does exhibit longitudinal variation very similar to the N2 ice, implying that CO and N2 condense and sublimate together, maintaining a consistent mixing ratio. Absorptions by H2O and CO2 ices show negligible variation as Triton rotates, implying very uniform and/or high latitude spatial distributions for those two non-volatile ices.
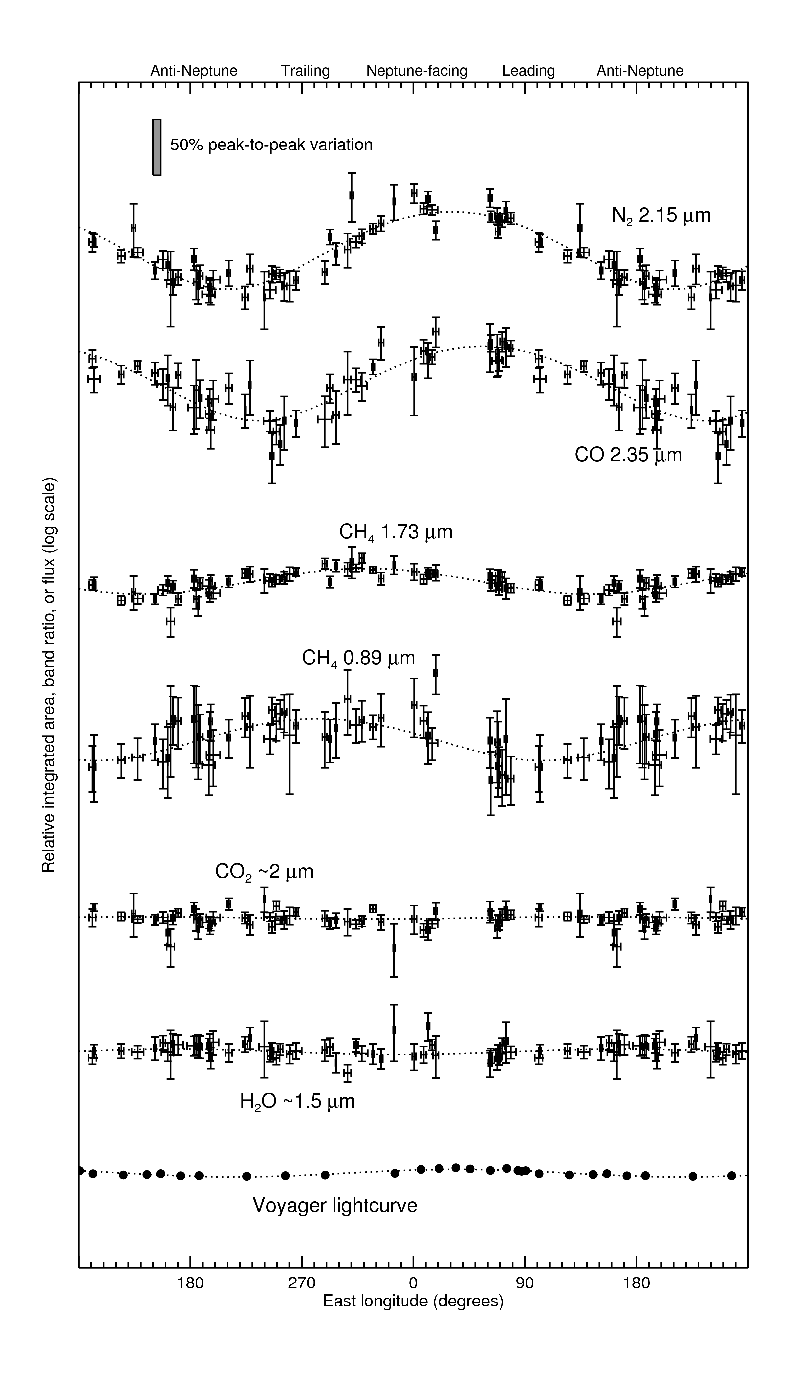
Fig. 10. Triton's observed longitudinal spectral variations shown on a consistent logarithmic scale of relative variation along with the Voyager clear filter approach lightcurve from Smith et al. (1989, bottom).
Circumstances of Triton Observations
| UT date | lon | lat | minutes |
| 2002/07/17 9:53 | 124.3 | -49.8 | 84 |
| 2002/07/18 9:36 | 184.8 | -49.8 | 64 |
| 2002/07/19 9:31 | 245.8 | -49.8 | 68 |
| 2002/07/20 9:27 | 306.9 | -49.8 | 68 |
| 2002/07/21 9:29 | 8.2 | -49.8 | 68 |
| 2002/07/22 9:21 | 69.1 | -49.8 | 84 |
| 2002/09/16 6:19 | 249.5 | -49.9 | 84 |
| 2002/10/03 6:32 | 211.0 | -49.9 | 48 |
| 2003/07/04 13:58 | 101.0 | -49.6 | 64 |
| 2003/08/10 10:09 | 196.4 | -49.7 | 58 |
| 2003/09/10 9:32 | 292.6 | -49.8 | 40 |
| 2003/10/16 5:51 | 327.5 | -49.8 | 88 |
| 2004/06/28 13:07 | 194.9 | -49.3 | 152 |
| 2004/08/12 12:19 | 67.7 | -49.5 | 52 |
| 2004/09/12 10:51 | 161.7 | -49.6 | 48 |
| 2004/10/21 6:13 | 18.0 | -49.6 | 52 |
| 2005/07/04 13:06 | 244.3 | -48.9 | 146 |
| 2005/09/19 8:02 | 265.2 | -49.3 | 68 |
| 2006/05/26 14:52 | 62.3 | -48.4 | 40 |
| 2006/06/26 13:39 | 157.9 | -48.5 | 128 |
| 2006/07/26 11:01 | 188.0 | -48.6 | 72 |
| 2006/08/30 9:14 | 166.0 | -48.8 | 48 |
| 2006/10/28 5:59 | 170.3 | -49.0 | 68 |
| 2007/06/21 13:15 | 252.6 | -47.9 | 136 |
| 2007/06/22 13:10 | 313.7 | -47.9 | 160 |
| 2007/06/23 13:18 | 15.2 | -47.9 | 128 |
| 2007/06/24 14:06 | 78.5 | -47.9 | 88 |
| 2007/06/25 13:13 | 137.5 | -47.9 | 132 |
| 2008/06/24 14:36 | 182.9 | -47.3 | 56 |
| 2008/07/14 10:57 | 318.3 | -47.4 | 72 |
| 2008/09/01 7:02 | 68.1 | -47.8 | 56 |
| 2008/09/28 9:55 | 288.5 | -48.0 | 60 |
| 2009/06/22 14:35 | 102.2 | -46.6 | 32 |
| 2009/06/24 14:25 | 224.3 | -46.6 | 80 |
| 2009/07/21 12:07 | 71.7 | -46.8 | 64 |
| 2009/08/13 12:07 | 39.8 | -47.0 | 56 |
| 2009/08/31 11:07 | 60.0 | -47.2 | 42 |
| 2010/08/07 11:08 | 71.9 | -46.3 | 56 |
| 2010/08/30 9:55 | 36.9 | -46.5 | 80 |
| 2011/06/07 15:01 | 348.0 | -45.1 | 24 |
| 2011/06/11 15:01 | 233.0 | -45.1 | 28 |
| 2011/06/12 14:23 | 292.7 | -45.1 | 86 |
| 2011/06/20 14:40 | 63.4 | -45.1 | 50 |
| 2011/06/28 14:31 | 193.0 | -45.2 | 60 |
| 2011/08/06 12:04 | 54.8 | -45.5 | 60 |
| 2011/08/23 9:08 | 8.1 | -45.6 | 64 |
| 2011/09/18 9:42 | 161.3 | -45.9 | 56 |
| 2011/11/13 6:07 | 341.4 | -46.2 | 144 |
| 2012/06/25 14:19 | 111.6 | -44.3 | 80 |
| 2012/07/18 14:43 | 81.1 | -44.5 | 66 |
| 2012/09/02 7:01 | 357.9 | -44.9 | 72 |
| 2012/09/05 9:44 | 188.5 | -45.0 | 284 |
| 2012/09/08 8:41 | 9.5 | -45.0 | 200 |
| 2012/09/09 9:52 | 73.7 | -45.0 | 224 |
| 2012/09/10 9:51 | 134.9 | -45.0 | 228 |
| 2012/09/12 10:03 | 257.9 | -45.1 | 232 |
| 2012/09/13 8:54 | 316.1 | -45.1 | 248 |
| 2013/07/23 15:11 | 70.1 | -43.6 | 36 |
| 2013/07/25 14:55 | 191.9 | -43.6 | 48 |
| 2013/07/28 14:57 | 15.7 | -43.6 | 56 |
| 2014/08/04 13:49 | 122.9 | -42.8 | 135 |
| 2014/08/05 13:19 | 182.9 | -42.8 | 155 |
| 2014/08/06 13:10 | 243.7 | -42.8 | 175 |
| 2014/08/10 12:57 | 128.1 | -42.8 | 167 |
| 2014/08/11 12:59 | 189.4 | -42.9 | 171 |
| 2015/07/03 14:00 | 5.2 | -41.5 | 108 |
| 2015/07/22 13:60 | 88.8 | -41.6 | 143 |
| 2015/08/02 14:49 | 44.5 | -41.7 | 48 |
| 2015/10/01 05:31 | 192.6 | -42.8 | 68 |
| 2016/07/31 13:40 | 21.7 | -40.7 | 150 |
| 2016/08/16 12:19 | 278.0 | -40.9 | 144 |
| 2016/09/06 9:02 | 115.3 | -41.2 | 72 |
| 2016/11/05 5:28 | 180.1 | -41.8 | 80 |
| 2017/07/08 14:19 | 96.0 | -39.4 | 88 |
| 2017/07/30 10:46 | 354.3 | -39.6 | 88 |
| 2017/08/13 11:40 | 133.9 | -39.7 | 64 |
| 2017/09/12 10:04 | 166.7 | -40.2 | 64 |
| 2018/09/26 9:52 | 344.6 | -39.3 | 84 |
| 2019/08/27 11:15 | 352.5 | -37.6 | 167 |
| 2019/08/28 11:28 | 54.3 | -37.6 | 159 |
| 2019/08/29 11:58 | 116.8 | -37.7 | 179 |
| 2019/08/31 12:26 | 240.5 | -37.7 | 147 |
| 2019/09/01 11:60 | 300.6 | -37.7 | 175 |
| 2019/09/02 11:36 | 0.8 | -37.7 | 183 |
| 2020/06/30 14:23 | 150.8 | -35.8 | 64 |
| 2020/07/30 13:06 | 185.0 | -36.0 | 48 |
| 2020/08/30 11:05 | 278.2 | -36.5 | 48 |
| 2020/10/04 10:29 | 259.7 | -37.1 | 54 |
| 2020/10/31 9:28 | 110.4 | -37.4 | 48 |
| 2020/11/25 6:16 | 193.3 | -37.5 | 48 |
| 2021/07/14 14:23 | 329.3 | -34.7 | 80 |
| 2021/07/27 14:23 | 45.6 | -34.8 | 68 |
| 2021/09/18 10:33 | 41.3 | -35.5 | 64 |
| 2021/10/22 8:03 | 316.8 | -36.1 | 60 |
| 2022/07/25 14:10 | 323.5 | -33.5 | 76 |
| 2022/08/06 13:30 | 336.7 | -33.6 | 64 |
| 2022/09/04 11:10 | 306.7 | -34.0 | 60 |
| 2022/09/27 9:06 | 269.7 | -34.4 | 56 |
| 2022/10/23 7:09 | 56.8 | -34.8 | 60 |
| 2023/08/10 14:13 | 264.5 | -32.3 | 64 |
| 2023/10/04 9:45 | 21.0 | -33.2 | 52 |
| 2023/10/22 8:29 | 39.9 | -33.5 | 64 |
| 2023/11/12 6:18 | 240.3 | -33.8 | 64 |
| 2024/08/27 12:02 | 322.1 | -31.3 | 44 |
| 2024/08/28 12:30 | 24.5 | -31.3 | 104 |
| 2024/08/29 13:04 | 87.2 | -31.3 | 128 |
| 2024/10/23 5:43 | 196.3 | -32.3 | 64 |
(see preprint for details regarding data up to 2009/07/21)
(contact Will Grundy, Leslie Young, and Bryan Holler for details on the more recent data)