Distributions of H2O and CO2 ices on Ariel, Umbriel, Titania, and Oberon from IRTF/SpeX observations
Published in 2006: Icarus 184, 543-555.
W.M. Grundy1,2, L.A. Young1,3, J.R. Spencer3, R.E. Johnson4, E.F. Young1,3, and M.W. Buie2
(1) Visiting/remote observer at the Infrared Telescope Facility, operated by the University of Hawaii under contract from NASA.
(2) Lowell Observatory, Flagstaff AZ.
(3) Southwest Research Institute, Boulder CO.
(4) University of Virginia Dept. of Engineering Physics, Charlottesville VA.
Abstract
We present 0.8 to 2.4 micron spectral observations of uranian satellites, obtained at IRTF/SpeX on 17 nights during 2001-2005. The spectra reveal for the first time the presence of CO2 ice on the surfaces of Umbriel and Titania, by means of 3 narrow absorption bands near 2 microns. Several additional, weaker CO2 ice absorptions have also been detected. No CO2 absorption is seen in Oberon spectra, and the strengths of the CO2 ice bands decline with planetocentric distance from Ariel through Titania. We use the CO2 absorptions to map the longitudinal distribution of CO2 ice on Ariel, Umbriel, and Titania, showing that it is most abundant on their trailing hemispheres. We also examine H2O ice absorptions in the spectra, finding deeper H2O bands on the leading hemispheres of Ariel, Umbriel, and Titania, but the opposite pattern on Oberon. Potential mechanisms to produce the observed longitudinal and planetocentric distributions of the two ices are considered.
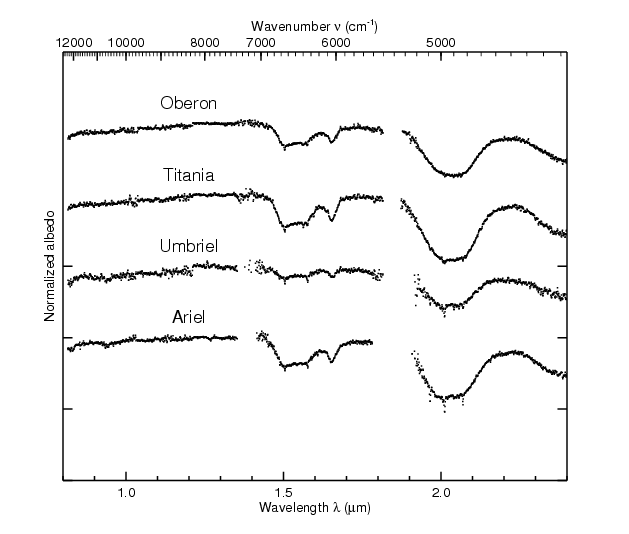
Figure 1
Fig. 1. Example spectra of uranian satellites, normalized at
J band and offset upward with zero levels indicated by tick marks on
the ordinate axis. Gaps around 1.4 and 1.85 microns coincide with high
atmospheric opacity. The Ariel spectrum is an average of all spectra with
subsolar longitudes between 210 and 330 degrees. The Umbriel spectrum
is from 2005/09/18 UT and the Titania and Oberon spectra are both from
2005/10/13 UT. Data for these spectra are available via links below.
Figure 4
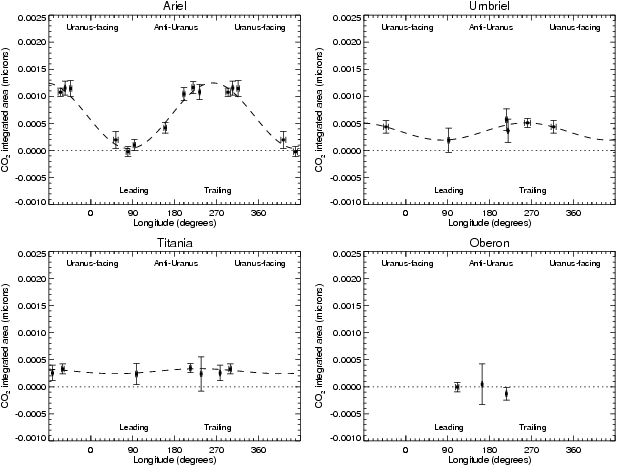
Fig. 4. Variation of total integrated area of the three strongest CO2 ice bands near 2 microns. Sine fits are plotted as dashed curves. Both the integrated areas and their longitudinal variation decline with planetocentric distance. No CO2 absorption was detected in the Oberon spectra.