
Comet Hyakutake (1996 B2) was discovered 30 January 1996 by Yuji Hyakutake using binoculars. It was soon determined that it would pass close by the Earth in late March 1996. At its closest approach of only 0.1 AU (16 million kilometers), its tail stretched across more than 60° of the sky.
Here at Lowell Observatory, we (in collaboration with scientists from the University of Maryland and the University of Florida) obtained photometric measurements on 13 nights from early February to mid-April, CCD images on 13 consecutive nights in late March, and spectroscopic measurements on 3 nights during Hyakutake's closest approach.
Our initial analysis (Schleicher et al. 1997) focused on the periodic lightcurve from photometry (Millis et al. 1996; IAUC 6372) and repeating morphological features in the CCD images (Schleicher et al. 1996; IAUC 6372) to derive a rotation period of 6.23+/-0.03 hr.
More recently, we have completed a full analysis of our photometric dataset, and the many results have been submitted to the journal Icarus for publication (Schleicher and Osip 2001). With the inclusion of additional lightcurve data from Lisse et al. (1999), we performed a new analysis of Hyakutake's rotation period, yielding a refined value of 6.274+/-0.007 hr. The combined data sets also allowed us to tightly constrain the onset of a major outburst to within a few hours of March 19.9. In addition, the photometry obtained throughout the apparition was used by Schleicher and Osip to examine the heliocentric distance dependences of the production rates, and determine gas abundance ratios, dust colors, and the effective active area as a function of time.
We (Schleicher and Woodney 2001) have also now completed analysis and modeling of the inner-coma dust morphology exhibited by Hyakutake during the second half of March. Two spiral dust jets -- a primary jet, along with a much weaker secondary jet -- are visible throughout the interval and are produced by nucleus rotation. The appearance of the dust jets changed dramatically from a nearly face-on view to side-on by March 28 due to the rapid change in viewing geometry.
Our Monte Carlo modeling of the dust jets has permitted us to determine the orientation of the rotation axis of Hyakutake's nucleus and the size and location of the two source regions which produce the jets. The modeling yields the pole orientation of the nucleus, with an obliquity of 108° with respect to Hyakutake's orbital plane (for comparison, the Earth's obliquity is 23.5°). The primary active region is centered at approximately -66° latitude, and has a radius of about 56°, and therefore covers about 22% of the surface, while the source of the secondary jet is at a latitude of -28°, has a radius of about 16°, and is located at a longitude nearly 180° away from the primary source. This solution for the nucleus orientation and source locations naturally results in a strong change in activity with season, explaining the strong asymmetry in rate of release of dust and gas before and after perihelion.
Animation sequences showing Hyakutake rotating have been created from both the enhanced CCD images and our best jet model solution, with the two jets in the model color-coded to distinguish them:
|
|
| March 24 | March 28 |
|
(Note the strong dust tail which is not included in the model.) |
We can create a synthetic view of our model nucleus by forcing any particles not emitted to remain on a synthetic nucleus surface and then zooming in on this. We also hide particles on the far side of the nucleus, and hide most particles on the night hemisphere to effectively darken it, thereby making the terminator evident. Below is an animation of this model nucleus and the surrounding few kilometers. Immediately evident is the circumpolar region which releases material throughout the rotation cycle because it receives sunlight continually. A portion of the primary source also points towards Earth each rotation; hence, our view is from within the broad primary jet for a portion of each cycle. With a sub-Earth latitude of -45° on this date, the southern edge of the secondary source just misses sweeping across the Earth.
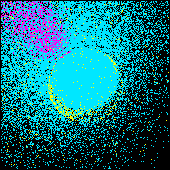
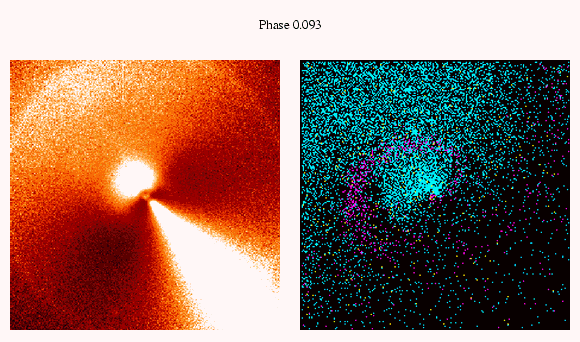
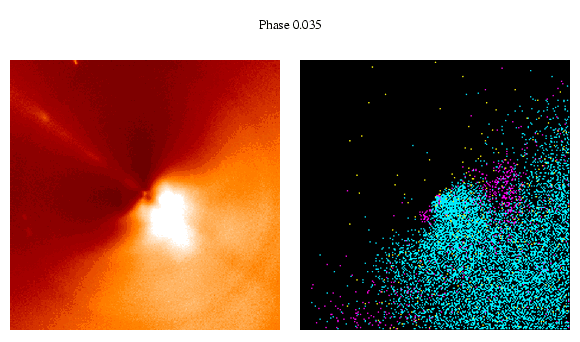
On March 23, 24 and 25 narrowband filters from the IHW (International Halley Watch) set were used. This allowed us to image comets in specific gas species. All of the gas and dust images are first flux calibrated, then C2 contamination is removed from the blue continuum filter (4845 Å) images. Finally, the dust is removed from each of the gas images by scaling and subtracting the decontaminated blue continuum image from the gas images. What remains is pure gas.
Below we show an animation of enhanced red continuum dust (left) and CN gas (right) images. Each pair of images shown was taken within minutes of each other so that they are at the same phase. There are two jets visible in the CN just as there are in the dust. Notice that the gas jets move outward faster than in the dust images. The first CN jet has a projected outflow velocity from 0.4 to 0.9 km/sec while the velocity of the second jet is 0.7 to 1.8 km/sec.

Last Modified 25 September 2001